
PALLYWALLYU / CAMPUS BASIC NEEDS INNOVATION EXCHANGE
What 34 Campus Basic-Needs Surveys Actually Tell Us
Twenty-eight named universities, six systemwide studies, and the patterns higher education cannot afford to miss.
PALLYWALLYU EDITORIAL · OCT 19, 2026
A food pantry can be full and a student can still go hungry. A campus can offer emergency grants and have students who have never heard of them. The best basic-needs surveys expose both facts at once: how much hardship students experience, and how hard the institution makes it to get help.
This review draws on 28 named college or university survey examples, plus six distinct systemwide or statewide initiatives. It extends the supplied survey inventory with university reports from Arizona, Ohio State, Oregon State, James Madison, UC Davis, Penn State and Cornell. Rates below describe respondents to specific instruments and time windows; they should not be treated as apples-to-apples rankings.
| The central finding: food insecurity is widespread, but the service-navigation gap may be the most actionable outcome a campus survey can reveal. |
What the numbers say before we compare campuses
In a nationally representative federal analysis, the U.S. Government Accountability Office estimated 23% of college students were food insecure in 2020, or about 3.8 million people. Many voluntary institutional surveys report substantially higher percentages. Both can be accurate for their populations and methods: reference periods, food-security scales, participation and campus composition differ. [35]
The Hope Center’s 2023–24 Student Basic Needs Survey gathered 74,350 responses at 91 participating institutions. It found 41% food insecurity, 48% housing insecurity and 14% homelessness; 59% reported food or housing insecurity. That participating sample is not nationally representative, but it demonstrates why individual campuses need local evidence. [36]
28 named universities: what their surveys found
Each capsule names the time period, reports the available survey finding without inventing a missing percentage, and notes what the result suggests for campus practice. A “food insecurity” result is not the same as a food-worry item or a combined food-and-housing outcome.
01. American University (Washington, DC) (2016). A campus survey reported that 44% of students had faced food insecurity. Why it matters: The figure is frequently cited in campus reporting, but the full survey report is not easily accessible publicly; treat as a campus-reported estimate. [1]
02. The College of New Jersey (2018 #RealCollege). Of 804 respondents, 18% were food insecure, 19% housing insecure and 8% experienced homelessness; 31% experienced at least one of the three. Only 6% of food-insecure students used SNAP. Why it matters: Rates were lower than four-year comparison institutions but still affected nearly one-third on at least one measure. [2]
03. Cornell University (Summer 2022 student-led Basic Needs Survey). More than 560 people, including undergraduates, graduates, alumni and faculty, responded to a student-led basic-needs survey. Student Assembly reporting said roughly one-third of respondents struggled with food insecurity; its mixed participant group means that figure should not be treated as campus prevalence. Why it matters: Small or mixed-population advocacy surveys can highlight problems but need very careful claims about whom they represent. [3]
04. George Washington University (Washington, DC) (Fall 2024). The NOURISH study found that more than one-third of students experienced food insecurity. Food-insecure students reported significantly poorer physical health, higher stress and limited use of available campus food resources. Why it matters: Important because it links prevalence to health and service underuse. [4]
05. James Madison University (2023 Student Basic Needs Survey). The full 2023 campus report identified 38.6% of respondents as food insecure (n=473), with graduate respondents reporting higher rates. A separate university news account of the same period reported 37.8%; these two published presentations use slightly different figures. Why it matters: An example of why the precise report, numerator and denominator should accompany a headline rate. [5, 38]
06. Kansas State University (2016–2017 academic year; published 2019). 44.3% of respondents met the study definition of food insecurity. Although 71.8% knew assistance might be available, 91.6% had not used food-assistance services; only 6.3% had used SNAP. Why it matters: The awareness-use gap suggests stigma, eligibility confusion and reluctance to seek help are major barriers. [6]
07. Marshall University (Fall 2022). 28.5% of survey participants indicated some level of food insecurity; 15% skipped or considered skipping a meal for financial reasons. Why it matters: Skipping-meal data translate the prevalence rate into a concrete student behavior. [7]
08. Metropolitan State University of Denver (2019, 2022 and 2024 student surveys). Campus reporting describes more than 40% food insecurity in 2019, 35% low or very low food security in 2022, and close to 60% in a spring 2024 survey. Measures and recruitment differed, so this is not a clean trend line. Why it matters: Public summaries do not consistently reproduce the exact campus percentage, so the row avoids inventing one; see Additional Findings for newer, sourced figures. [8, 39]
09. Northern Illinois University (2023 research). Among students with very low and low food security, 19.1% and 28.2%, respectively, were unaware of the NIU food pantry. Why it matters: Even students with severe need may not know a pantry exists. [9]
10. The Ohio State University (2024 Student Life Survey). The university reported that 32% of surveyed students experienced food insecurity. A separate 24% said they could not come up with $400 for an emergency. Why it matters: Directly links a campus survey finding to an investment in an integrated resource hub. [10]
11. Oregon State University (Fall 2020 survey; 2023–24 follow-up). The Fall 2020 campuswide email survey found a 31.6% food-insecurity rate; 25.7% of students with a dining plan were also food insecure. A 2023–24 follow-up studied 656 surveyed students and nine interviews, focusing on meal-plan users. Why it matters: Paying for a meal plan does not automatically mean a student has adequate access to food. [11, 40]
12. Pennsylvania State University (Fall 2022 universitywide Food and Housing Needs Survey). Among 17,231 respondents (19.5% response rate), more than 14% said they had gone an entire day without eating in the preceding 30 days because they could not afford food. At University Park, 14.6% reported trouble securing enough food daily; at other campuses, 18.4% reported food concerns. Why it matters: An unusually concrete model of survey-to-service outreach, while showing why different question types should not be conflated. [12]
13. Rutgers University–New Brunswick (2018–2020 report period). Rutgers documented substantial food, housing and basic-needs insecurity and major disparities among student groups; the report used the USDA 18-item food-security module. Why it matters: A comprehensive campus report; subgroup disparities are as important as the overall rate. [13]
14. Temple University (Current campus reporting). 52% of surveyed Temple students experienced food insecurity, housing insecurity or homelessness in the previous 30 days. The figure is a combined basic-needs measure, not food insecurity alone. Why it matters: Temple houses The Hope Center, but national Hope Center findings should not be attributed solely to Temple students. [14]
15. University of Arizona (Spring 2021). In its inaugural student basic-needs survey, 35% of respondents reported food insecurity in the preceding 12 months and 8% a disruption in permanent housing. Approximately 76% of food-insecure respondents and 94% of housing-insecure respondents had not contacted relevant supports. Why it matters: A campus can have resources yet fail to reach students who do not know about them or believe they are ineligible. [15]
16. University of California, Davis (Fall 2025 student-led basic-needs survey; published 2026). An undergraduate survey retained 337 usable responses after data cleaning. On a question about worrying that food would run out, 35% selected “sometimes,” while 43% selected “never.” This is a food-worry item, not a USDA-scored food-insecurity prevalence estimate. Why it matters: A valuable campus assessment can be informative without producing a nationally comparable prevalence rate. [16]
17. University of Delaware (2018 #RealCollege). Approximately 1 in 4 students experienced food insecurity in the prior 30 days. Later qualitative work examined how the problem affected daily life and academic choices. Why it matters: Shows that employment does not necessarily protect students from food insecurity. [17]
18. University of Hawaiʻi at Mānoa (2017). 44% of 593 respondents reported food insecurity. Earlier research found 21% food insecure and another 24% at risk. Why it matters: Similar rates across years suggested persistent structural need rather than a temporary spike. [18]
19. University of Illinois Urbana-Champaign (Survey published 2023). Among 888 undergraduate and graduate respondents, 22% experienced food insecurity in the prior year; about 10% faced persistent food insecurity in both the prior year and prior month. First-generation, Black, Hispanic and government-aid recipients were at greater risk. Why it matters: Distinguishing episodic from persistent food insecurity helps target emergency versus sustained assistance. [19]
20. University of Maryland, College Park (2019). 20% of students had experienced food insecurity in the previous 12 months; respondents described effects on health, academic performance and career progress. Why it matters: Useful because it documented consequences, not only prevalence. [20]
21. University of New Mexico (2020 and 2021). Food insecurity was 31.7% in 2020 and 26% in 2021. Housing insecurity was 41.4% in 2020 and 43.5% in 2021. Food-insecure students had lower GPAs and were nearly twice as likely to fail or withdraw from a course in spring 2020. Why it matters: Food and housing trends moved differently, showing why campuses should measure multiple needs separately. [21]
22. University of Northern Colorado (Spring 2023). More than 50% of both undergraduate and graduate respondents reported some degree of food insecurity in the prior 30 days. Why it matters: A very high campus rate affecting both undergraduate and graduate students. [22]
23. University of Washington Tacoma (2016–2023 series). Food insecurity rose from 36% in 2016 to 42% in 2018 and 48% in 2022; a 2023 NCHA measure found 46%, while the campus Food Equity and Basic Needs Survey found 44%. Why it matters: Repeated use of the same USDA six-item module makes the upward trend especially informative. [23]
24. University of Wisconsin–Madison (Spring 2025 survey, released April 2026). A random invitation of 7,500 students generated a 27% response rate. Among undergraduates, 27% reported food insecurity in the prior 30 days; the survey also found food insecurity correlated with a lower GPA (3.39 versus 3.54). Why it matters: A recent institutionwide baseline that can support future trend measurement. [24]
25. Virginia Commonwealth University (Recent campus food-access research). University reporting described roughly 35% of students experiencing food insecurity before and after the pandemic. The study examines barriers and support options rather than establishing a systemwide trend. Why it matters: Research emphasizes scalable delivery methods and the need to reach students who avoid traditional pantries. [25]
26. Virginia Tech (2018–19 and 2023 student surveys). In 2018–19, 29% of undergraduates and 35% of graduate students were food insecure; a 2023 survey reported 33.81% of undergraduates and 35.71% of graduate students food insecure (34.51% combined). Why it matters: The comparison highlights that statewide household rates can understate student need; see Additional Findings for the university's own 2018–19 and 2023 surveys. [26]
27. West Virginia University (Fall 2023 NCHA). Nearly 50% of WVU students reported some level of food insecurity, more than four percentage points higher than in 2021. Why it matters: The increase despite existing services indicates demand can outpace pantry capacity. [27]
28. Western Washington University (November 2024). Western reported a 45.4% food-insecurity rate, compared with 43.8% across surveyed Washington students. Highest-risk groups included first-generation students, former foster youth, Black students, students with disabilities and low-income students. Why it matters: The subgroup findings identify where targeted outreach is most needed. [28]
Six broader surveys put individual campuses in context
System and statewide studies are included separately; a single survey of a network does not equal one independent survey at each member campus. Their value is a common questionnaire and policy visibility across institutions.
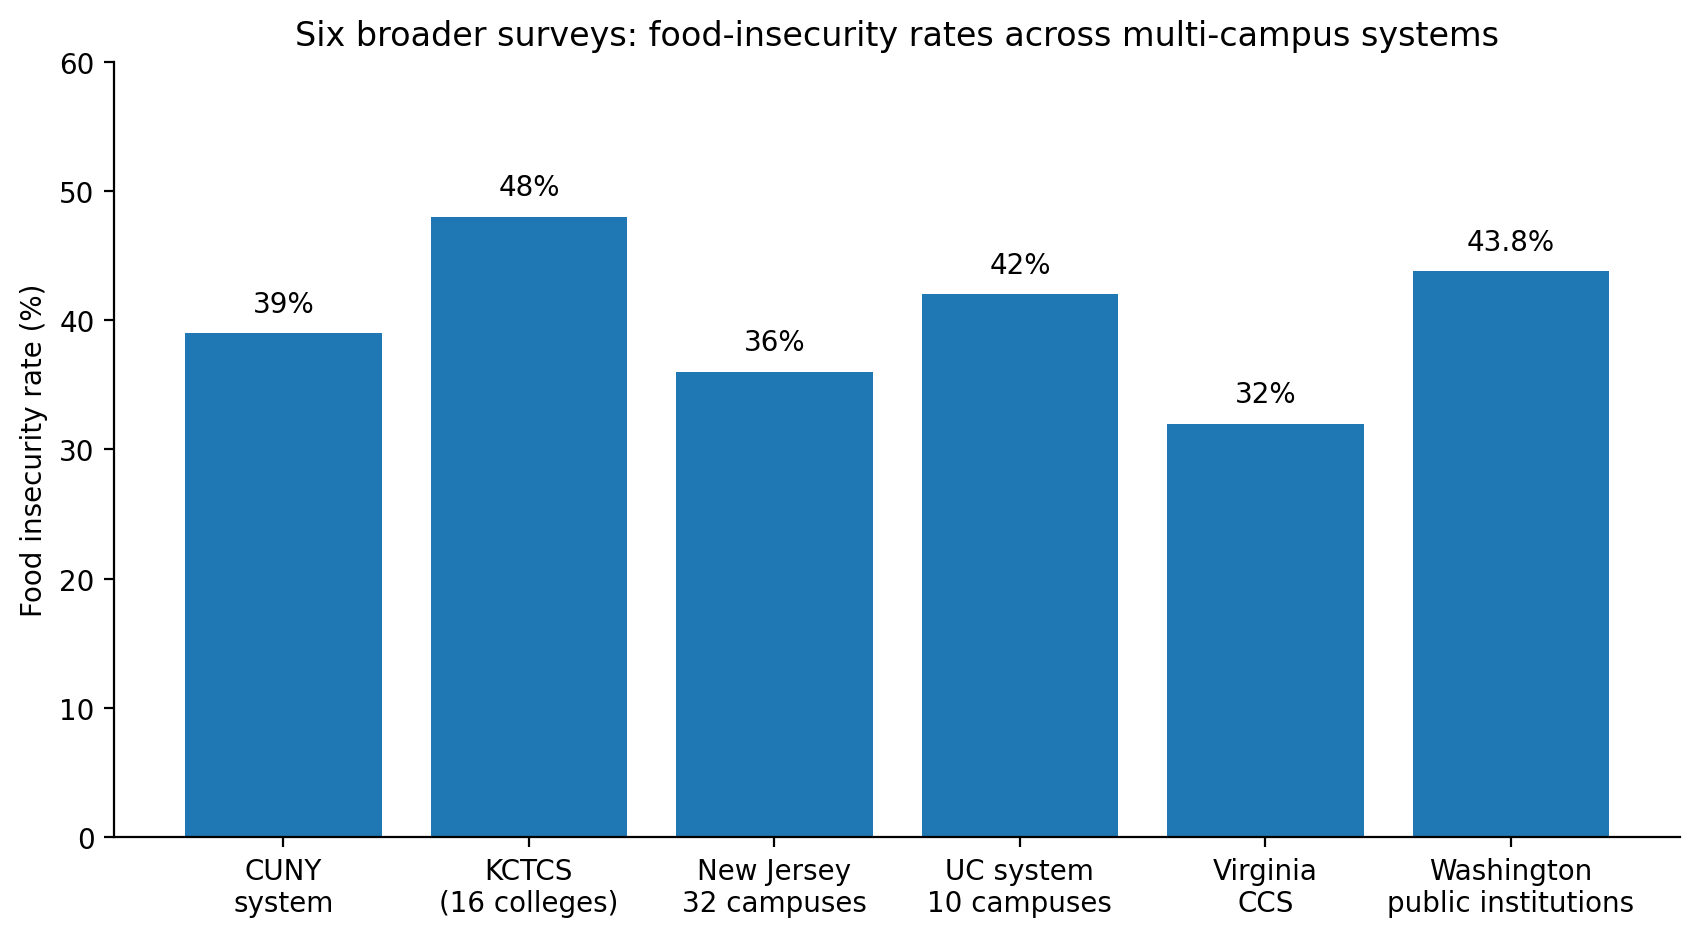
Chart 1. Food-insecurity rates from the six broader surveys included for systemwide or statewide context. These are not directly interchangeable with single-campus surveys because methods, populations, and recall periods differ by study. Sources: references [29]–[34].
01. City University of New York (CUNY) system (2010 (report 2011)). About 39% of CUNY undergraduates were likely to experience food insecurity regularly; Black and Latino students were disproportionately affected and food insecurity overlapped with housing and financial hardship. Why it matters: Foundational urban-university survey showing that commuter and working students also face substantial hunger. [29]
02. Kentucky Community and Technical College System (16 colleges) (2024 Trellis survey; reported 2025). 48% of responding students reported food insecurity; 48% were housing insecure and 45% were parents. Why it matters: Parenting and housing data show that food insecurity is part of a broader affordability challenge. [30]
03. New Jersey higher-education institutions (32 campuses) (Spring 2025). Among 11,877 respondents, 36% experienced food insecurity; the rate rose to 50% among Pell Grant recipients. Why it matters: Statewide data provide a common benchmark and show the much higher risk among low-income students. [31]
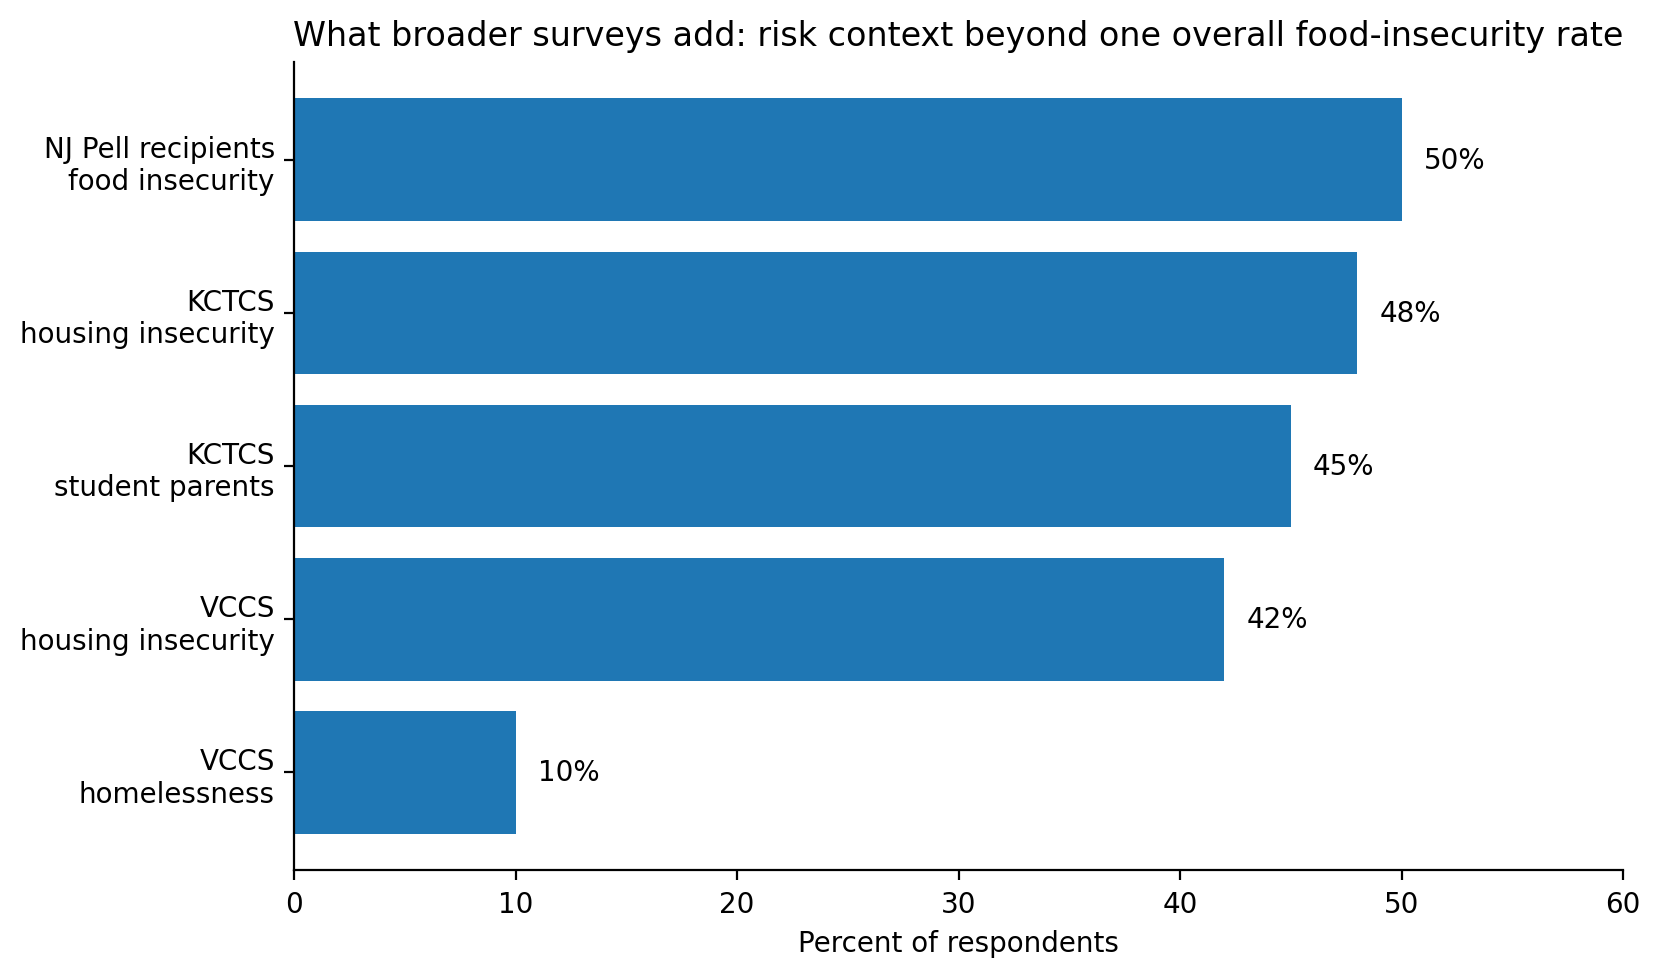
Chart 2. Broader surveys often show more than a single food-insecurity figure. They can reveal added context about higher-risk subgroups and overlapping needs such as housing insecurity, parenting, and homelessness. Sources: references [30], [31], and [33].
04. University of California system (10 campuses) (2015). Among 8,932 respondents, 42% experienced food insecurity in the prior year: 23% low food security and 19% very low food security. Why it matters: A landmark random-sample system study. It established that food insecurity was a systemwide issue, not an isolated campus problem. [32]
05. Virginia Community College System (2020; reported 2021). 32% reported food insecurity in the prior 30 days, 42% experienced housing insecurity in the prior year and 10% experienced homelessness. Why it matters: One of the clearest statewide community-college snapshots. [33]
06. Washington public postsecondary institutions (2024 Student Experience Survey). The statewide survey reported 43.8% food insecurity among Washington college students, a 14% increase from the prior survey referenced by participating campuses. Why it matters: Statewide measurement enables cross-campus comparisons but institution-specific rates should be reported separately when available. [34]
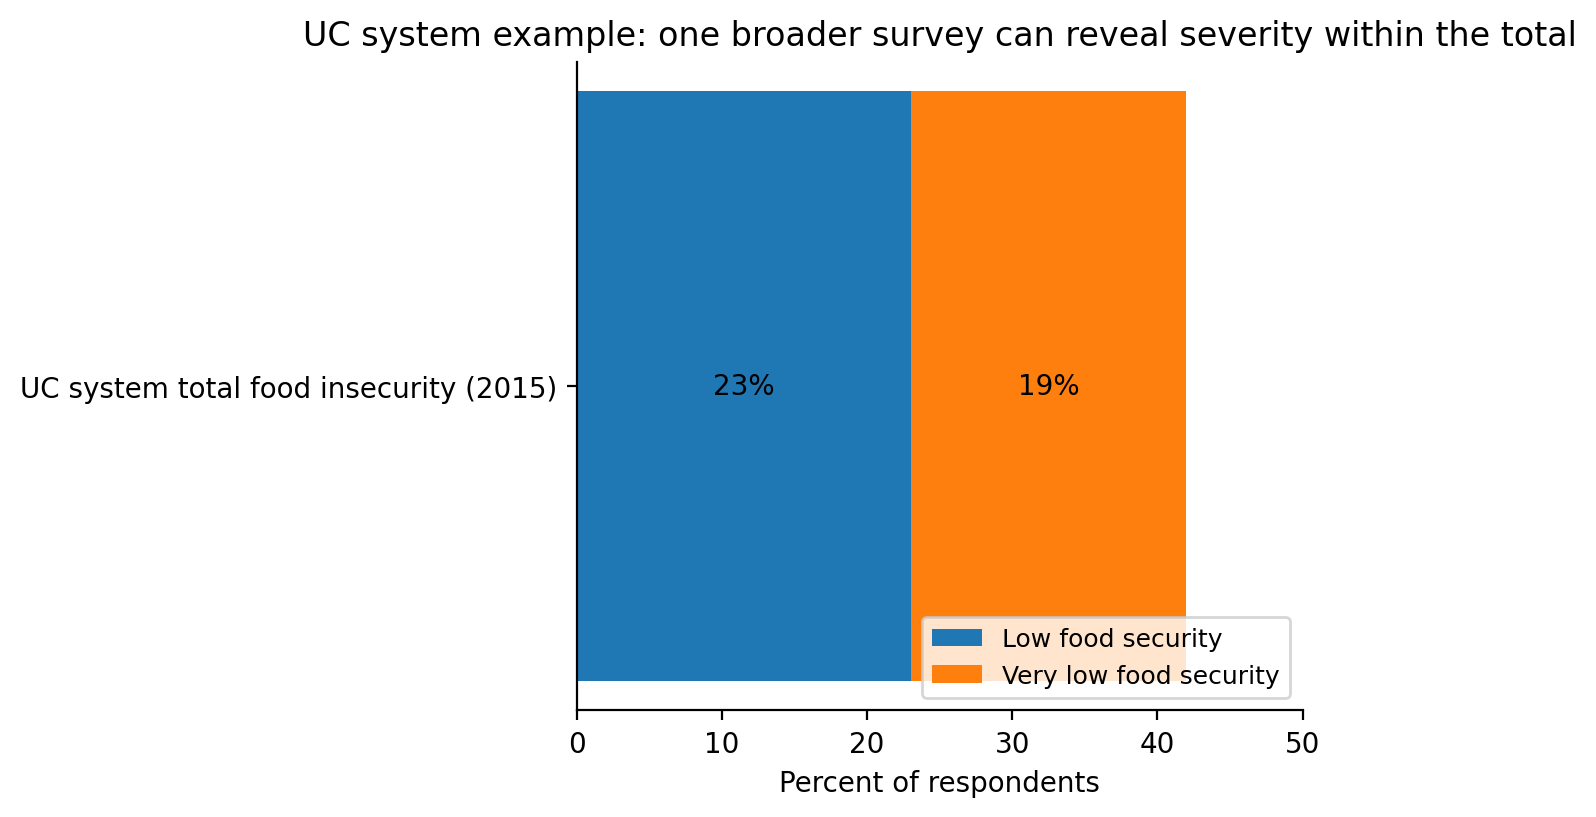
Chart 3. The University of California system study is a useful example of why broader surveys matter: a single total can be broken into lower- and higher-severity forms of food insecurity. Source: reference [32].
Five patterns more important than a campus league table
1. Food and housing rarely travel alone
New Mexico’s 2020–21 findings show why: food insecurity declined while housing insecurity increased. At Kentucky community colleges, food and housing insecurity each affected 48% of respondents. A pantry-only strategy misses the rent, transportation and child-care pressures that force food trade-offs. [21, 30]
2. Awareness and utilization are different outcomes
Kansas State’s study reported 44.3% food insecurity, yet 91.6% had not used food-assistance services. Arizona’s student survey reported that large majorities of students experiencing food and housing insecurity did not contact supports. A useful survey must ask whether students know resources exist, think they qualify, can reach them and trust the process. [6, 15]
3. Disparities disappear inside a single campus average
Survey reports repeatedly identify elevated risk among Pell recipients, first-generation students, Black and Indigenous students, student parents, disabled students, and other groups historically underserved by higher education. Report subgroup estimates with denominators and appropriate disclosure protections, not just a single institutionwide number. [19, 36]
4. Repeated measurement is useful only when definitions hold steady
UW Tacoma’s multi-year sequence suggests rising food insecurity over time, while Penn State’s two rounds show how surveying can also trigger direct follow-up. But changes in USDA modules, recall periods or who responds can produce an apparent trend that is not real. Keep a stable core questionnaire and disclose differences when one must change. [23, 12]
5. A survey becomes valuable when it changes a workflow
Penn State reported outreach to more than 7,000 respondents with immediate needs; Ohio State opened an integrated essential-needs center; Arizona published the barriers to help-seeking. The lesson is not that each intervention has already been proven to improve persistence, but that an assessment should lead to a testable institutional response. [12, 10, 15]
The one-page campus action plan
First, publish results with the exact population, dates, instrument, 30-day or 12-month recall, respondents and response rate. Second, pair prevalence with awareness, unmet need and service follow-through. Third, disaggregate safely to see whom the aggregate hides. Fourth, assign owners and budgets to the top three barriers. Finally, repeat the same core measures so the next report can say what has actually changed.
PallyWallyU’s role in that cycle should be practical and testable: campuses can pilot a curated, accessible directory and referral handoff alongside existing basic-needs staff, then measure verified referrals and successful connections—not presume that a technology platform closes the gap on its own.
Sources and research notes
Scope: 28 named institutions and 6 system/state surveys. Sources [1]–[34] support the 34 survey capsules; [35]–[37] cover national and survey-method background. See [38]–[40] for supplementary survey publications supporting statements for JMU, MSU Denver and Oregon State. Full URLs and sources from the supplied research inventory appear below. No single list implies nationally comparable prevalence or independent verification of all campus-reported figures.
[1] American University (Washington, DC) — 2016. View source · student newspaper opinion referencing a reported campus figure
[2] The College of New Jersey — 2018 #RealCollege. View source · campus report / institution or research account
[3] Cornell University — Summer 2022 student-led Basic Needs Survey. View source · student-government resolution; nonrepresentative advocacy survey
[4] George Washington University (Washington, DC) — Fall 2024. View source · campus report / institution or research account
[5] James Madison University — 2023 Student Basic Needs Survey. View source · campus report / institution or research account
Full URL: https://www.jmu.edu/ssh/_files/jmu_student_basic_needs_survey_report.pdf
[6] Kansas State University — Miller et al. (2019), Food Insecurity and Assistance on Campus: A Survey of the Student Body. View source · original published research article
Full URL: https://newprairiepress.org/ojrrp/vol14/iss2/1/
[7] Marshall University — Fall 2022. View source · Associated Press secondary reporting
Full URL: https://apnews.com/article/bca1f64030815b4210c7e5c5df31af13
[8] Metropolitan State University of Denver — 2019, 2022 and 2024 student surveys. View source · institutional 2022 news report; other MSU Denver rounds supported by [39]
[9] Northern Illinois University — 2023 research. View source · campus report / institution or research account
[10] The Ohio State University — 2024 Student Life Survey. View source · institutional news coverage of survey and service response
Full URL: https://news.osu.edu/ohio-state-students-leaders-mark-monda-student-resource-center-opening/
[11] Oregon State University — 2019 campus survey; 2023–24 follow-up. View source · follow-up study; original Fall 2020 report at [40]
[12] Pennsylvania State University — Fall 2022 universitywide Food and Housing Needs Survey. View source · campus report / institution or research account
[13] Rutgers University–New Brunswick — 2018–2020 report period. View source · campus report / institution or research account
[14] Temple University — Current campus reporting. View source · campus support webpage; reported combined measure
Full URL: https://studentaffairs.temple.edu/support-advocacy/basic-needs-support
[15] University of Arizona — Spring 2021. View source · campus report / institution or research account
Full URL: https://basicneeds.arizona.edu/learn/understanding-basic-needs
[16] University of California, Davis — Fall 2025 student-led basic-needs survey; published 2026. View source · campus report / institution or research account
Full URL: https://irl.ucdavis.edu/news/2025-undergraduate-basic-needs-report
[17] University of Delaware — 2018 #RealCollege. View source · campus report / institution or research account
Full URL: https://udspace.udel.edu/items/d1d4a914-54f3-421f-b4b2-ae46eea3e1fa
[18] University of Hawaiʻi at Mānoa — 2017. View source · campus report / institution or research account
Full URL: https://manoa.hawaii.edu/studentlife/wp-content/uploads/2018-2019-Annual-Report-In-Person-Year-1.pdf
[19] University of Illinois Urbana-Champaign — Survey published 2023. View source · campus report / institution or research account
Full URL: https://aces.illinois.edu/news/how-college-students-cope-episodic-and-persistent-food-insecurity
[20] University of Maryland, College Park — 2019. View source · campus report / institution or research account
Full URL: https://today.umd.edu/survey-finds-food-insecurity-among-terps-f8743b73-65d7-458e-8562-534780c2215e
[21] University of New Mexico — 2020 and 2021. View source · campus report / institution or research account
Full URL: https://basicneeds.unm.edu/basic-needs-2021-report.pdf
[22] University of Northern Colorado — Spring 2023. View source · campus report / institution or research account
Full URL: https://www.unco.edu/news/articles/bear-pantry-rennovation-24/
[23] University of Washington Tacoma — 2016–2023 series. View source · campus report / institution or research account
Full URL: https://www.tacoma.uw.edu/sites/default/files/2024-04/food-equity-basic-needs-survey-report.pdf
[24] University of Wisconsin–Madison — Spring 2025 survey, released April 2026. View source · campus report / institution or research account
Full URL: https://students.wisc.edu/news/uw-survey-offers-first-comprehensive-look-at-student-basic-needs/
[25] Virginia Commonwealth University — Recent campus food-access research. View source · institutional news describing research; additional background paper below
Full URL: https://news.vcu.edu/article/2022/11/food-for-thought
[26] Virginia Tech — 2018–19 and 2023 student surveys. View source · campus report / institution or research account
Full URL: https://vtechworks.lib.vt.edu/items/af1afbdf-6280-4eb0-9783-6b679a49dd97
[27] West Virginia University — Fall 2023 NCHA. View source · campus report / institution or research account
[28] Western Washington University — November 2024. View source · campus report / institution or research account
Full URL: https://news.wwu.edu/support-westerns-whole-food-pantry
[29] City University of New York (CUNY) system — 2010 (report 2011). View source · system/state study
[30] Kentucky Community and Technical College System (16 colleges) — 2024 Trellis survey; reported 2025. View source · system/state study
Full URL: https://kctcs.edu/newsroom/news/2025/2025-02-07-feeding-kentucky.aspx
[31] New Jersey higher-education institutions (32 campuses) — Spring 2025. View source · system/state study
Full URL: https://www.fdu.edu/fdumagazine/winter-spring-2026/a-place-at-the-table/
[32] University of California system (10 campuses) — 2015. View source · system/state study
Full URL: https://www.ucop.edu/institutional-research-academic-planning/services/survey-services/SFIS.html
[33] Virginia Community College System — 2020; reported 2021. View source · system/state study
[34] Washington public postsecondary institutions — 2024 Student Experience Survey. View source · system/state study
Full URL: https://wsac.wa.gov/media-2025-02-03-wa-student-experience-survey
[35] U.S. Government Accountability Office, GAO-24-107074 (2024). View source · nationally representative comparator
Full URL: https://www.gao.gov/products/gao-24-107074
[36] The Hope Center, 2023–24 Student Basic Needs Survey Report (2025). View source · participating-institution comparison
[37] USDA Economic Research Service, Food Security Survey Tools (2026). View source · instrument definitions
Full URL: https://ers.usda.gov/topics/food-nutrition-assistance/food-security-in-the-us/survey-tools
Supplementary publications cited in the article
[38] James Madison University, “A quiet crisis” (Nov. 21, 2023): independent institutional news presentation of the 37.8% result.
Full URL: https://www.jmu.edu/news/2023/11/21-food-insecurity.shtml
[39] Metropolitan State University of Denver, “As food insecurity on campus grows, students are Cooking With Purpose” (2024): spring 2024 survey nearly 60% figure.
[40] Oregon State University, “2020–2021 Oregon State University Food Security Study”: Fall 2020 survey, 31.6% email-sample rate and 25.7% meal-plan subgroup estimate.
Additional links in the supplied campus-survey research inventory
These links appear in the research inventory supplied for this project. They are provided for source transparency; no article prevalence estimate is inferred from them unless the corresponding evidence is cited above.
[B1] University of Minnesota AgEcon Search — research paper on VCU food-access strategies (listed in supplied survey inventory)
Full URL: https://ageconsearch.umn.edu/record/362811/files/1367.pdf
[B2] Virginia Tech — 2024 account of campus food-access expansion (inventory background)
Full URL: https://news.vt.edu/articles/2024/05/sa-food-access-expansion.html
[B3] UCLA Newsroom — California student food insecurity and CalFresh (inventory background)
Full URL: https://newsroom.ucla.edu/releases/california-college-students-food-insecurity-calfresh
[B4] MSU Denver RED — institutional news home (inventory reference, not a research report)
Full URL: https://red.msudenver.edu/
[B5] University of California Regents — March 2026 agenda attachment (inventory background)
Full URL: https://regents.universityofcalifornia.edu/regmeet/mar26/b5attach1.pdf
[B6] WVU research repository — thesis document (inventory background)
Full URL: https://researchrepository.wvu.edu/etd/3905/
[B7] Virginia legislative records — 2024 state-level background document (inventory background)
Full URL: https://rga.lis.virginia.gov/Published/2024/RD810/PDF
[B8] American Psychological Association — 2019 college-campus food insecurity news release (inventory background)
Full URL: https://www.apa.org/news/press/releases/2019/08/food-insecurity-campuses
[B9] California Student Aid Commission — Food and Housing Survey resource page (inventory background)
Full URL: https://www.csac.ca.gov/food-and-housing-survey
Source-use distinction. Numbered links are publications directly cited for the article’s claims. “Background references” reproduce additional links listed in the supplied research materials; they are not represented as independently verified evidence for an article statistic. The supplied attachments are working research compilations, not substitutes for original studies. A campus or media summary is labeled separately from a survey report when known. Reference details and website URLs were reviewed October 19, 2026; site content and access can change.