
PALLYWALLYU / CAMPUS BASIC NEEDS INNOVATION EXCHANGE
What the 2023–24 Student Basic Needs Survey reveals about hunger, housing, mental health, and the invisible barrier between students and existing support.
PALLYWALLYU CASE STUDY· OCT 19, 2026
The most unsettling statistic in the Hope Center’s latest national campus survey may not be the hunger figure. It is what happens after resources exist: almost two in three respondents said they were not aware of available supports. Nearly half of respondents experiencing at least one basic-needs insecurity used none of the campus supports that researchers asked about.
The Hope Center for Student Basic Needs at Temple University has surveyed college students for more than a decade, beginning with the #RealCollege work in 2015. More than 500 institutions and 500,000 students have participated over time. Its latest listed national Student Basic Needs Survey report, issued in February 2025, covers fieldwork in 2023–24.
| 59% reported food or housing insecurity. But the service gap—65% reporting lack of awareness of support—is an equally urgent institutional design challenge. |
What the latest survey actually measured
Between January 2023 and July 2024, 74,350 students at 91 participating colleges in 16 states completed the survey. Fifty-three thousand nine hundred seventy-eight attended two-year institutions and 20,372 attended four-year institutions. The sample is large and highly informative, but not a nationally representative random sample of all U.S. students. Participating institutions were concentrated in the community-college sector; their results should be interpreted as the experiences of participating respondents.
59% — experienced food insecurity and/or housing insecurity, including homelessness, in the reference period covered by the report.
41% — experienced food insecurity; the report uses a recent-period food-security measure and must not be compared without attention to instrument and recall period.
48% — experienced housing insecurity in the previous year, and 14% experienced homelessness. These categories can overlap.
73% — experienced at least one basic-needs insecurity when mental health, transportation, child care and technology access were included.
44% — screened positive for clinically significant anxiety and/or depression symptoms, based on the instruments used in the study; this is not a clinical diagnosis.
Taken together, the findings challenge the familiar assumption that college affordability is just tuition and textbooks. Students may be enrolled and working while facing unstable housing, unaffordable child care, missed transportation, lack of internet service or too little money for food.
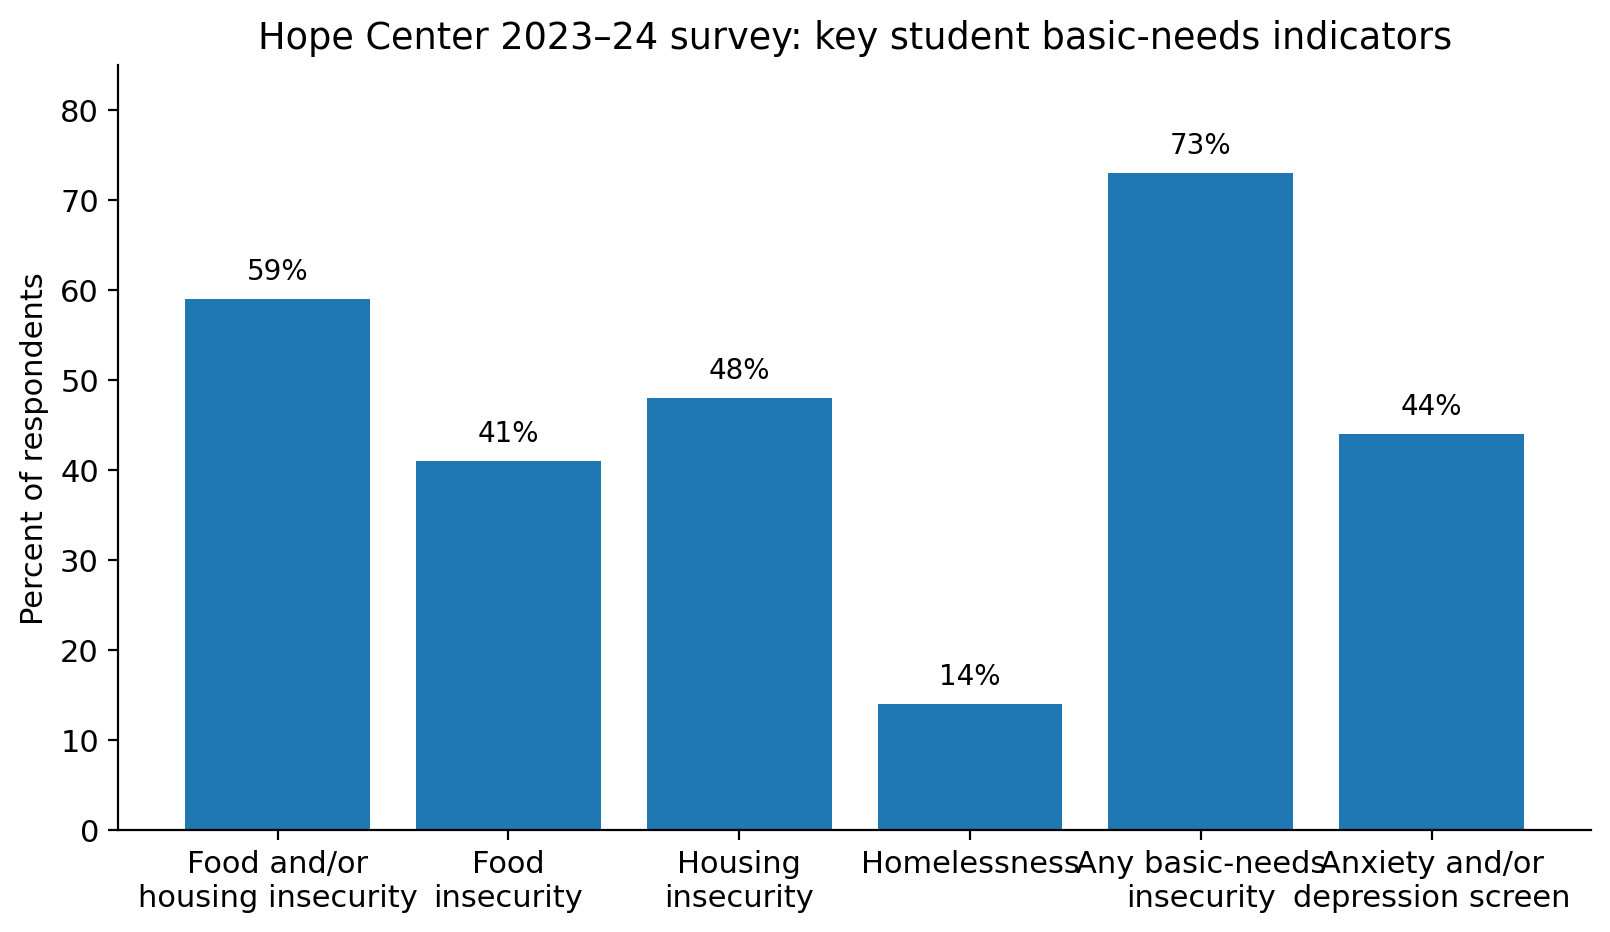
Chart 1. Snapshot of the Hope Center’s core 2023–24 student basic-needs findings. Source: The Hope Center, 2023–24 Student Basic Needs Survey Report.
The gap between having a service and reaching a student
The Hope Center reported that 65% of respondents lacked awareness of the campus supports available to them. Among respondents experiencing at least one form of basic-needs insecurity, 48% used none of the campus supports studied and 51% received no public benefits. Only 12% of respondents experiencing housing insecurity or homelessness used public housing or utility assistance, and only 8% of those who missed class because of transportation problems used public transportation assistance. These are distinct measures with distinct denominators; none proves every respondent was eligible for the relevant benefit.
The survey’s practical question is therefore not only “What services should we add?” but also “What stops students from reaching the services already funded?” That might mean confusing eligibility rules, inaccessible office hours, stigma, fragmented websites, limited staffing or an impossible referral maze. The particular barriers must be established locally rather than assumed from a national aggregate.
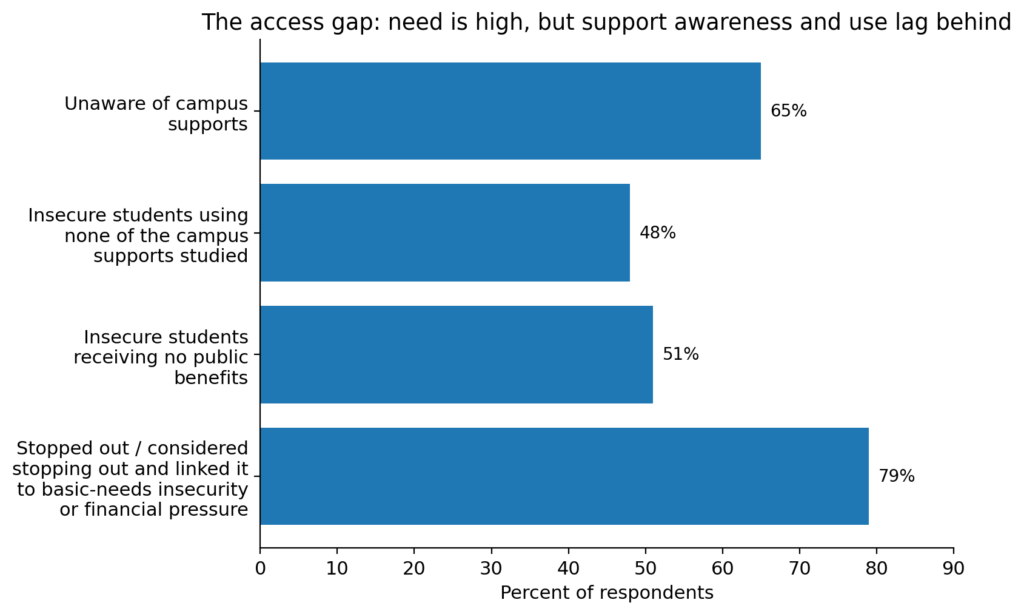
Chart 2. The article’s central theme: need is widespread, but awareness of support and take-up of help remain weak. Source: The Hope Center, 2023–24 Student Basic Needs Survey Report; 2025 Federal Policy Priorities.
The students hidden by the overall average
Nearly three-quarters of Black and Indigenous respondents reported food or housing insecurity, compared with 55% of White respondents. The Hope Center has highlighted especially high risk among Pell Grant recipients, part-time students, student parents, students with disabilities, former foster youth and students impacted by the justice system. Its 2025 policy materials also report food/housing insecurity among 74% of parenting students versus 55% of non-parenting students. These group comparisons are descriptive and depend on the populations who answered.
The implication is not to label students by identity or create one-size-fits-all assistance. It is to invite students with lived experience into survey design, provide accessible help in multiple forms, and ensure that campus resource use is measured for groups whose challenges vary in important ways.
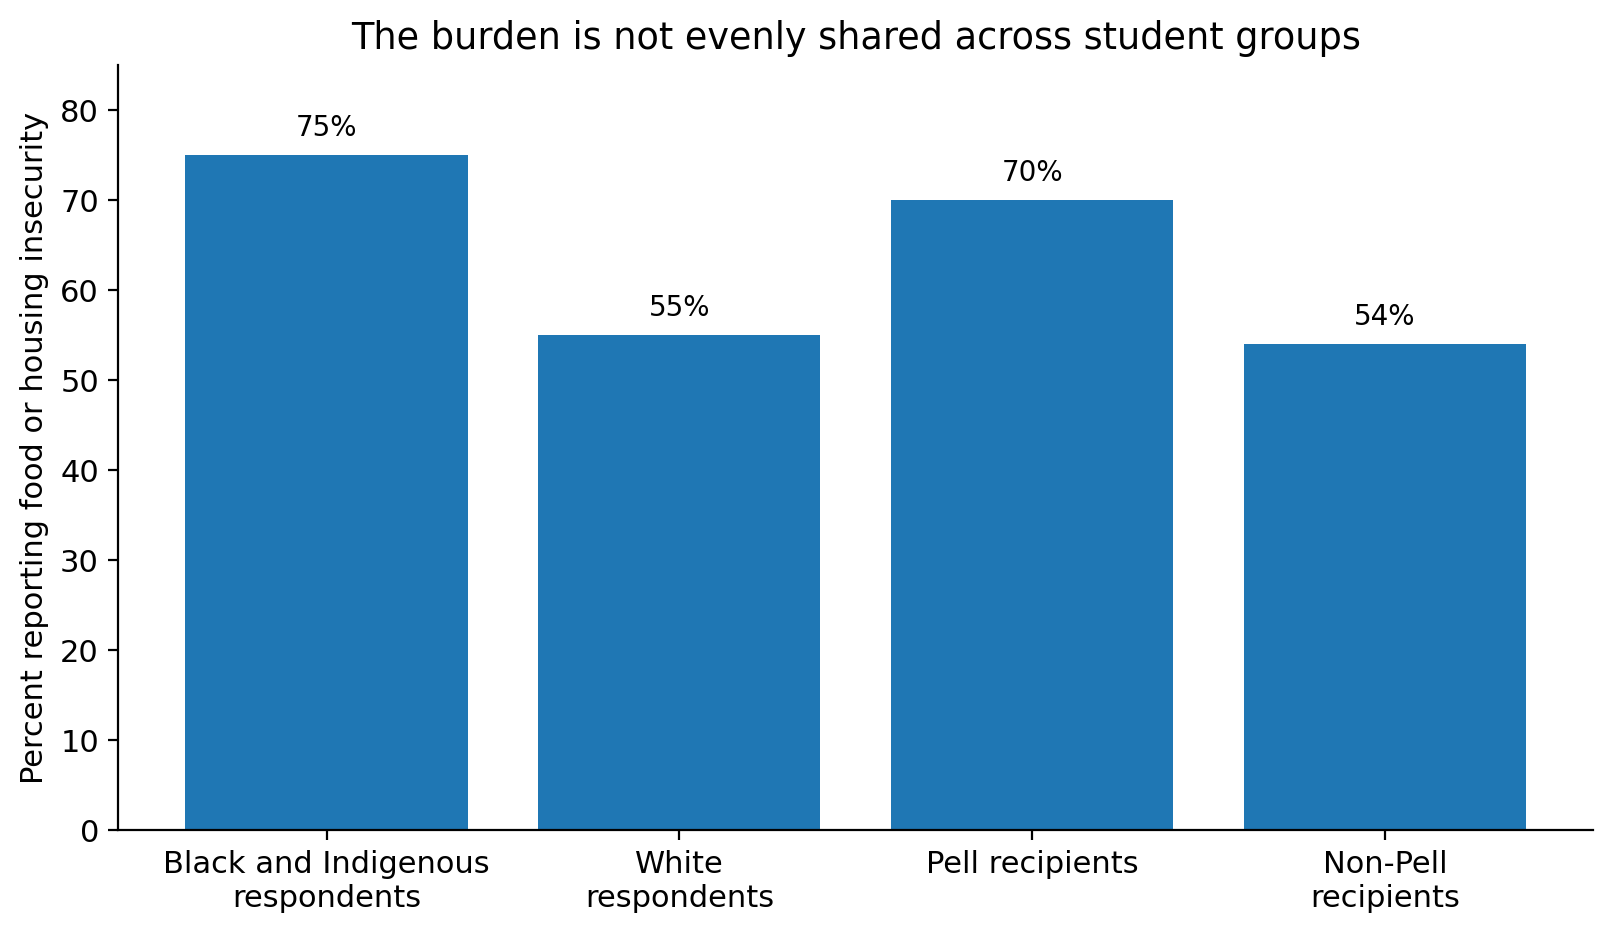
Chart 3. The burden of food or housing insecurity is unevenly distributed across student groups. Source: The Hope Center, 2023–24 Student Basic Needs Survey Report; 2025 Federal Policy Priorities.
Basic needs are closely tied to persistence
Among participants who had previously stopped out and returned, or were considering stopping out, 79% cited basic-needs insecurity or financial pressures as a reason. The underlying list included emotional stress and mental health, living expenses, child care, transportation, internet access, insufficient financial aid, books and emergency costs. That statistic refers to a selected group of respondents and their reported reasons; it is not a claim that 79% of all students will stop out, nor does it establish a causal effect from the survey alone.
The Hope Center also found that 57% of previously stopped-out respondents said mental health issues contributed to leaving. A survey of hardship should therefore connect to academic advising, counseling and retention efforts, rather than live as an isolated food-pantry report.
What the Hope Center’s larger research program adds
The reach of the evidence matters—but so do its limits
The Hope Center’s public survey history includes campus and state partnerships, reports on the pandemic, and institutional action planning through Hope Impact Partnerships. In a separate 2025 brief focused on community-college STEM students across 80 institutions in 14 states, 62% of STEM majors reported food and/or housing insecurity. That subgroup result adds detail, but it is not an independent nationally representative prevalence estimate.
Federal data provide a different, valuable lens
The Government Accountability Office used federal NPSAS data to estimate food insecurity among 23% of U.S. college students in 2020. In June 2026, Hope Center researchers discussed longitudinal NCES data showing 21.2% food insecurity among enrolled members of a 2019–20 entering cohort at a 2021–22 follow-up, plus 18.6% housing insecurity and 5.5% recent homelessness. A cohort-follow-up estimate and a participating-campus survey can differ without either being “wrong.”
Current policy priorities emphasize infrastructure and access
The Hope Center’s February 2026 federal priorities call for sustainable basic-needs hubs, a stronger federal Basic Needs Grant program, simplified access to SNAP, emergency aid, childcare support, student mental health funding, affordable health coverage and improved data collection. These are the Center’s policy recommendations, not outcomes established by the 2023–24 survey alone.
From evidence to a campus operating model
A campus can translate these findings into five questions: Where are students facing the highest unmet need? Which supports are hard to find? Which referrals fail? How quickly can a student reach a person when an issue is urgent? And do students who seek support report receiving useful help? Each question calls for a measure that staff can revisit next semester.
That is where the PallyWallyU Campus Innovation Exchange has a potential role. The platform publicly describes a student-centered way to locate essential resources and practical AI-powered tools. A campus could test whether a curated PallyWallyU resource pathway makes basic-needs information easier to locate and whether students complete an appropriate referral. The supplied briefing explicitly notes that independent results on referral accuracy, follow-through and user satisfaction were not available in that material. Any claim of impact would therefore require a local pilot, data safeguards, accessibility review and measured outcomes.
| A realistic pilot goal: not “prove AI solves basic needs,” but “reduce the number of students who cannot locate and complete a referral to support.” |
What campus leaders can do next semester
Use a standardized instrument with recurring field dates; publish both need and support-utilization indicators; make a current resource inventory available in the channels students actually use; assign an accountable staff owner to difficult referrals; and test a small set of changes against response time, successful handoffs and student feedback. In a crisis, automated guidance must never replace appropriate human and emergency-response pathways.
The Hope Center’s enduring contribution is to change the unit of analysis. College basic needs are not a series of isolated emergencies; they are a condition of academic participation. But a study is only the first step. A campus shows what it has learned when students can actually reach support before a missed meal becomes a missed class—or a stop-out.
Sources and research notes
The user-supplied Hope Center briefing and campus-survey inventory were reviewed as starting research materials. The numbered references below identify the specific published sources supporting the article. Additional links contained in the briefing are reproduced separately as background. The national survey report cited here covers 2023–2024 data and was published February 2025. The PallyWally descriptions are platform statements, not independent outcome evidence.
The Hope Center, 2023–24 Student Basic Needs Survey Report (February 2025). View source · core findings
The Hope Center, Student Basic Needs Survey: history, methodology, and Hope Impact Partnerships. View source · scope and implementation
https://hope.temple.edu/research/hope-center-basic-needs-survey
The Hope Center, 2023–24 Survey Report: Web Appendices. View source · methodology and detailed tables
https://hope.temple.edu/research/hope-center-basic-needs-survey/2023-24-survey-report-web-appendices
The Hope Center, 2025 Federal Policy Priorities. View source · parenting and Pell comparisons
https://hope.temple.edu/policy-advocacy/hope-centers-2025-federal-policy-priorities
The Hope Center, Being a STEM Student Is a Delicate Balancing Act (March 2025). View source · STEM subgroup study
https://hope.temple.edu/projects/national-science-foundation-s-stem-hub-project/being-a-stem-student
U.S. GAO, SNAP: Estimated Eligibility and Receipt among Food Insecure College Students (2024). View source · national comparator
https://www.gao.gov/products/gao-24-107074
The Hope Center, New Longitudinal Federal Data Reveal a Troubling Reality (June 2026). View source · longitudinal federal context
The Hope Center, 2026 Federal Policy Priorities (February 2026). View source · policy position
https://hope.temple.edu/policy-advocacy/2026-federal-policy-priorities
Additional links in the supplied Hope Center briefing
The attached briefing also listed these organizational and historical references. They are additional background, not extra independent support for the specific 2023–2024 survey percentages.
The Hope Center — main research and organizational homepage (listed in supplied briefing)
The Hope Center — 2024 Federal Policy Priorities (historical policy background from briefing)
https://hope.temple.edu/hope-center-2024-federal-policy-priorities
The Hope Center — January 2024 Lumina Foundation grant announcement (historical organizational background)
Source-use distinction. Numbered links are publications directly cited for the article’s claims. “Background references” reproduce additional links listed in the supplied research materials; they are not represented as independently verified evidence for an article statistic. The supplied attachments are working research compilations, not substitutes for original studies. A campus or media summary is labeled separately from a survey report when known. Reference details and website URLs were reviewed October 19, 2026; site content and access can change.